| Step |
Description |
Formula(s) |
Spreadsheet Formula(s) |
| 1. |
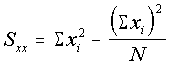
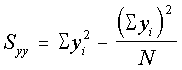
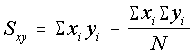
Calculate the three quantities Sxx, Syy,
and Sxy. |
|
Excel: Sxx: =N*VARP(x-range)
Syy:
=N*VARP(y-range)
Q-pro: Sxx: =N*@VAR(x-range)
Syy:
=N*@VAR(y-range)
(Sxy is not required if using a spreadsheet) |
| 2. |
Using these quantities, the slope (m) of the least-squares line
is |
m = Sxy / Sxx |
=slope(y-range, x-range)
(@slope for Q-Pro) |
|
The y-intercept (b) is |

where the barred y and x represent the arithmetic means
of y and x. |
=intercept(y-range, x-range)
(@intercept for Q-Pro) |
| 3. |
The concentration of the unknown is now found by solving for x
in the least-squares equation |
xu = [unk] = (yu -b) / m |
|
| 4. |
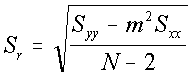
To get an estimate of the error (range of values) in the regression
line is given by Sr |
 |
=steyx(y-range, x-range)
(@steyx for Q-Pro) |
| 5. |
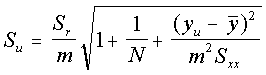
An estimate of the confidence range of the unknown concentration is |
 |
|